
Rainfall and Resilience: Closing the Gap with Community Data
by Holden Habermacher, guest blogger, global studies major at the University of Richmond
Hi Richmond!

Members of the University of Richmond’s RESILIENCE team. I’m pictured second from the right in a light gray t-shirt.
My name is Holden Habermacher, and I am a proud member of the RESILIENCE research team at the University of Richmond, working with Southside ReLeaf to make our city more resilient to flooding. RESILIENCE stands for Richmond Environmental Spatial Integration for Local Equity in Natural Climate Events, and our team is made up of both student and professional researchers. Student researchers include Lina Khatcheressian, Charles Gorby, Eden Burrell, Shawna Tarkington, Martin Sang, and me.
Each team member focused on a different aspect of the RESILIENCE Project: Water, Heat, Air, Trees, and Transportation. My focus was on analyzing rainfall and flood data for Richmond.
Background
The work I did over the summer was connected to “Go with the Flow,” a flood mapping project launched by Southside ReLeaf and the University of Richmond to encourage community members to document flooding in their neighborhoods every time it rains. The project is running from March 20 to September 1, 2025.
With the data collected from the flood survey, students at UR will create a detailed, accurate map of flood-prone areas in the city that takes into account the lived experiences of our neighbors. While the project focuses on Southside Richmond, contributions from across the city are welcome — the more data collected, the more precise the final map will be. With the data, Southside ReLeaf aims to bring attention to this issue and catalyze funding opportunities at local and state levels to help address the causes of flooding in Richmond.
How Accurate Are Current Flood Models?
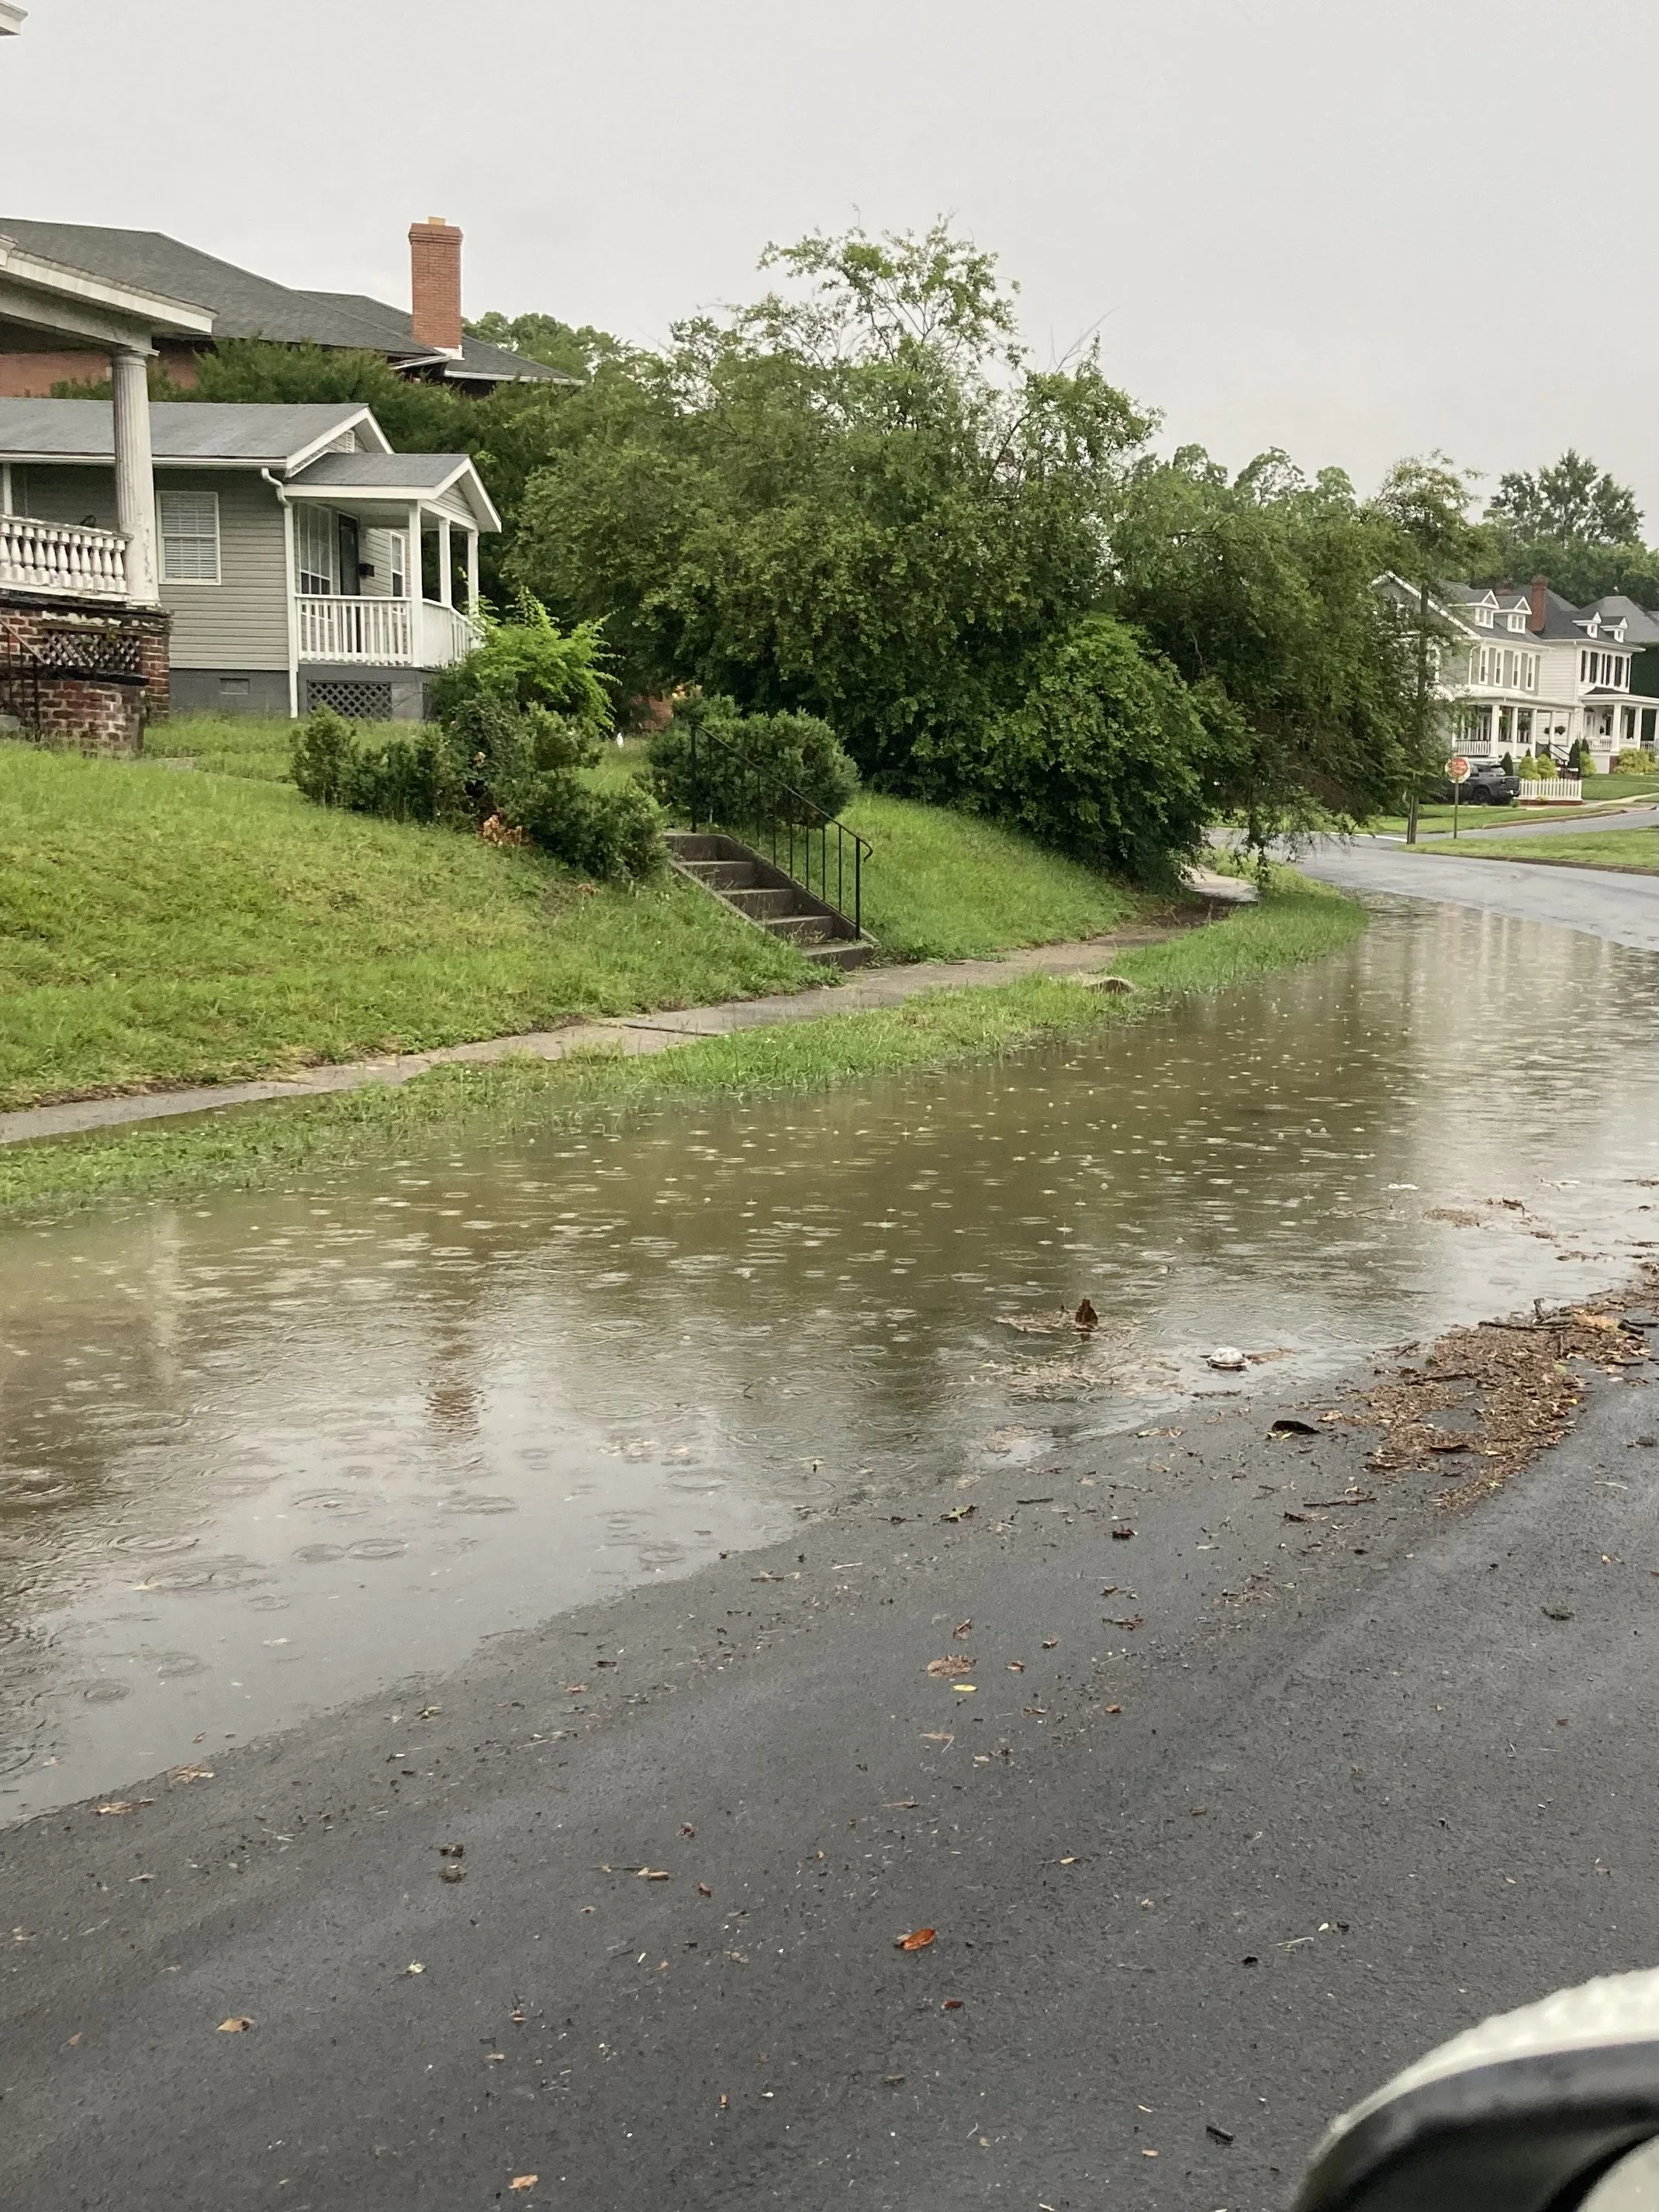
During the first three weeks of July 2025, Richmond had 10.37 inches of rain, the fourth-most on record for this period. Increased rainfall contributes to flash flood risk across the city. Flash flooding is rapid flooding that occurs within six hours of heavy rainfall and becomes dangerous, especially when traveling, because of the high, fast-moving water. This risk, however, is not spread equally throughout Richmond. Flood models aim to predict the susceptibility of mapped areas to flash floods.

My peers and I tested two flood models, one created by a UR student named Grace and one from the Virginia Department of Conservation and Recreation, against community reports of flooding. Neither flood model showed a clear difference between places that did and didn’t flood.
To better understand and verify flood risk, my peers and I compared multiple flood models using data from the “Go With the Flow” community survey. Each survey entry (“Yes” for flooded, “No” for not flooded) was matched with the flood susceptibility rating for that location. This helped us check whether the models accurately reflected real-world experiences. We found that neither model showed a significant difference in susceptibility between areas marked as “Flooded” and “Not Flooded.” In other words, the current flood models didn’t line up with what people were actually experiencing in their communities.
This is why the “Go With the Flow” project is so critical. The data we’re gathering helps us refine the flood model's accuracy by “ground truthing” the flooding that Richmond’s residents are experiencing in their neighborhoods.
Rainfall Isn’t the Same Everywhere

These scatter plot graphs compare rainfall at the University of Richmond and Richmond International Airport in 2022, 2023, and 2024. R-squared values range from 0 to 1, with a higher number showing more similarities between datasets.
Rainfall patterns can vary dramatically across the city. This summer’s storms highlighted how important it is to monitor where the rain hits the hardest. Our team used rainfall data from the University of Richmond campus, the Richmond International Airport, and multiple fire stations throughout the city. We analyzed the correlation between these different datasets. (Correlation ranges from 0 to 1 with higher numbers showing stronger agreement.) In 2022 and 2024, the campus and airport rainfall data were closely aligned. But in 2023, the correlation was much weaker, proving just how unpredictable rainfall can be across our region. Understanding these differences in rainfall patterns can help us better forecast future flood risk, especially as flooding will behave differently across each district.
Beyond the Data
From long hours in the Spatial Analysis Lab to collecting data across the city, the RESILIENCE team had a blast this summer. We visited restaurants around Richmond and found time for a round at Topgolf. Through this work, we gained a deep appreciation for the efforts of Southside ReLeaf and all the organizations dedicated to building a stronger, more resilient Richmond.
Your Voice, Your Streets, Your Data
Your voice matters — and your observations are essential.
Every time it rains in Richmond, you can help improve our city’s flood resilience by taking just a minute to share what you're seeing in your neighborhood. Whether your street floods regularly or not at all, your response helps us build a clearer, more accurate picture of where flooding is — and isn’t — happening across the city.
Here's how to participate:
Take the survey after each rain event between now and September 1, 2025.
Report whether or not you saw flooding near your home, school, work, or on your usual travel routes, including after it has stopped raining.
You can submit a new entry each time it rains — multiple submissions are encouraged.
Text FLOWRIDERS to (866) 719-9501 to receive text reminders to complete the survey.

By contributing your firsthand experience, you're helping Southside ReLeaf and the University of Richmond "ground truth" local flood data. Your input strengthens the accuracy of flood maps, shapes future climate resilience strategies, and helps advocate for funding to protect the neighborhoods most affected.
Let’s “go with the flow” and create a safer, more resilient Richmond for all.