
What 311 Data Reveals About Flooding in Richmond — and What It Misses
by Julia Norton, guest blogger, geography and environmental studies major at the University of Richmond
Spring in Richmond often brings steady rain (when we’re not in a drought, anyway!), and with it, standing water on streets, sidewalks, and in low-lying areas. While this kind of flooding may not always make headlines, it can make daily life harder: blocking sidewalks and driveways, limiting access to bus stops, and making it more dangerous to get around, especially for pedestrians and wheelchair users.
These everyday flooding issues are not experienced equally across the city, and they’re not always fully captured in official data. One of the primary ways flooding gets documented in Richmond is through the city’s 311 system — a system for residents to submit non-emergency service requests. But many residents don’t report issues, whether due to past experiences, long response times, or uncertainty about whether reporting will lead to change.
So what can 311 data tell us about flooding in Richmond — and what might it be missing?
In this analysis, I examine nearly a decade of flood-related 311 calls to better understand where stormwater flooding is reported, how the city responds, and what patterns emerge across neighborhoods. While 311 data doesn’t capture every instance of urban flooding, it remains an important tool for identifying trends and holding the city accountable for addressing known issues.
Where Flooding Gets Reported — and Where it Doesn’t
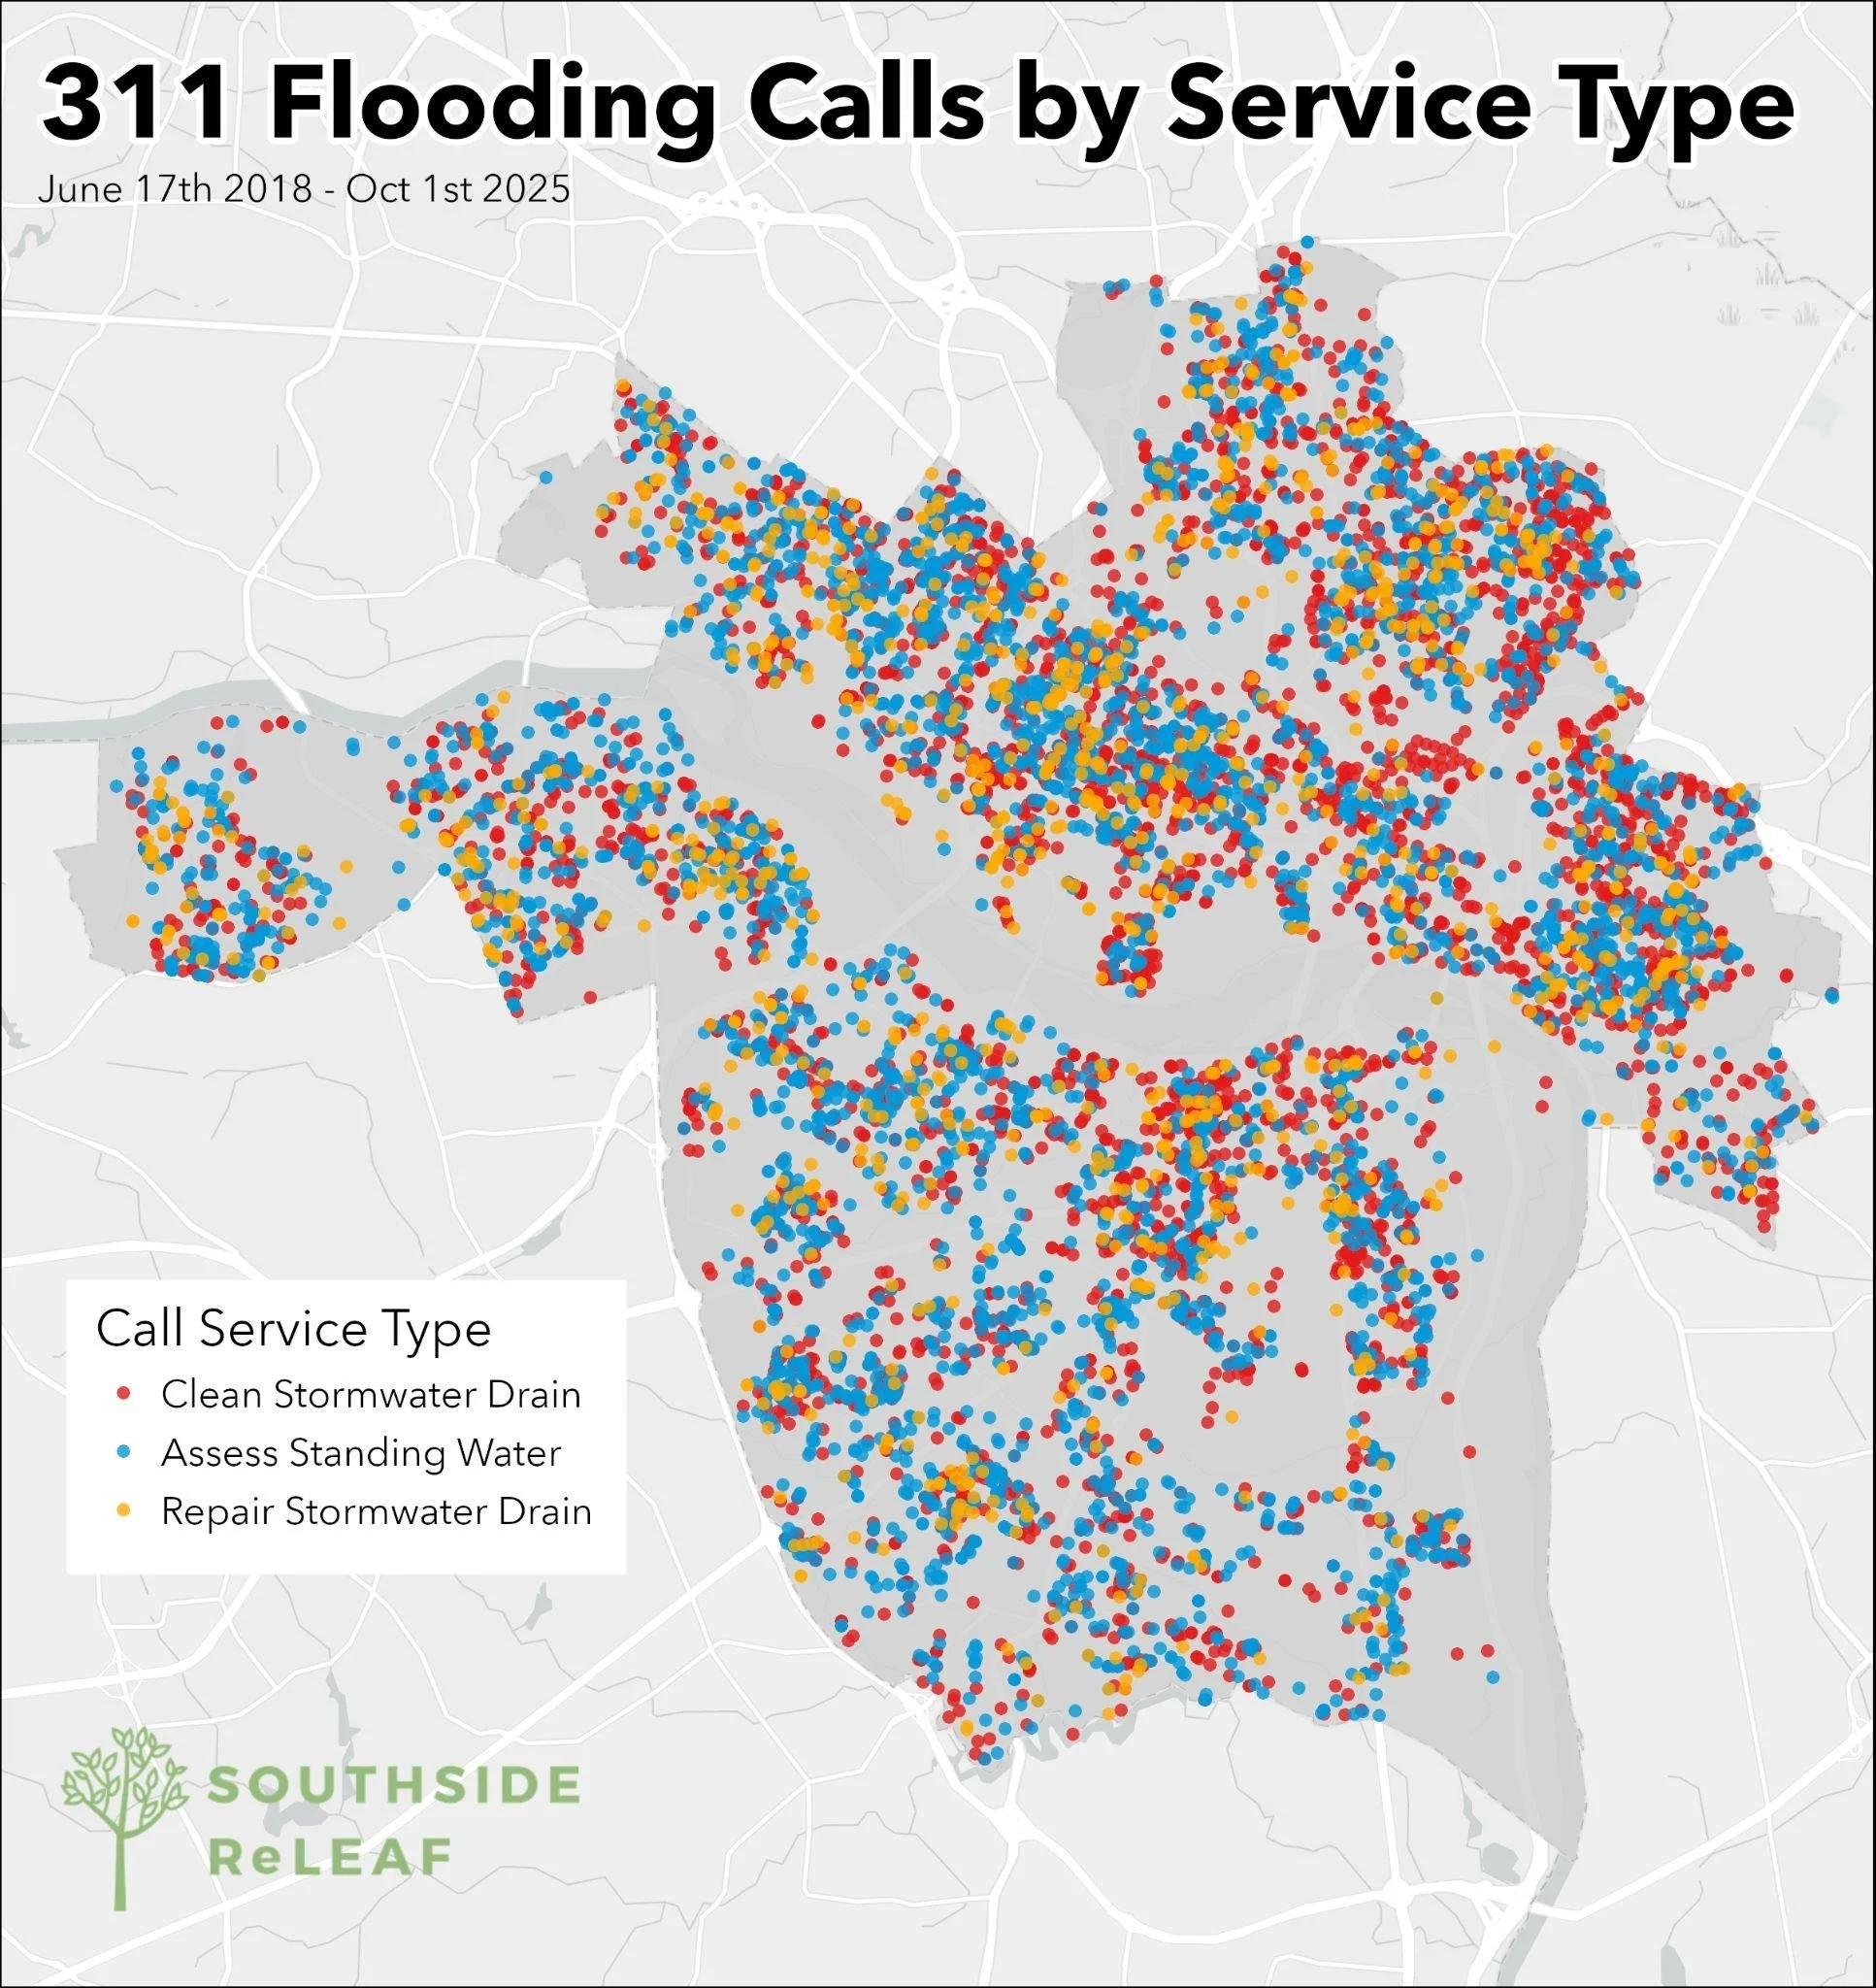
Figure 1. 311 flooding calls by service types (clean storm drains, assess standing water, and repair stormwater drains) in Richmond, Virginia.
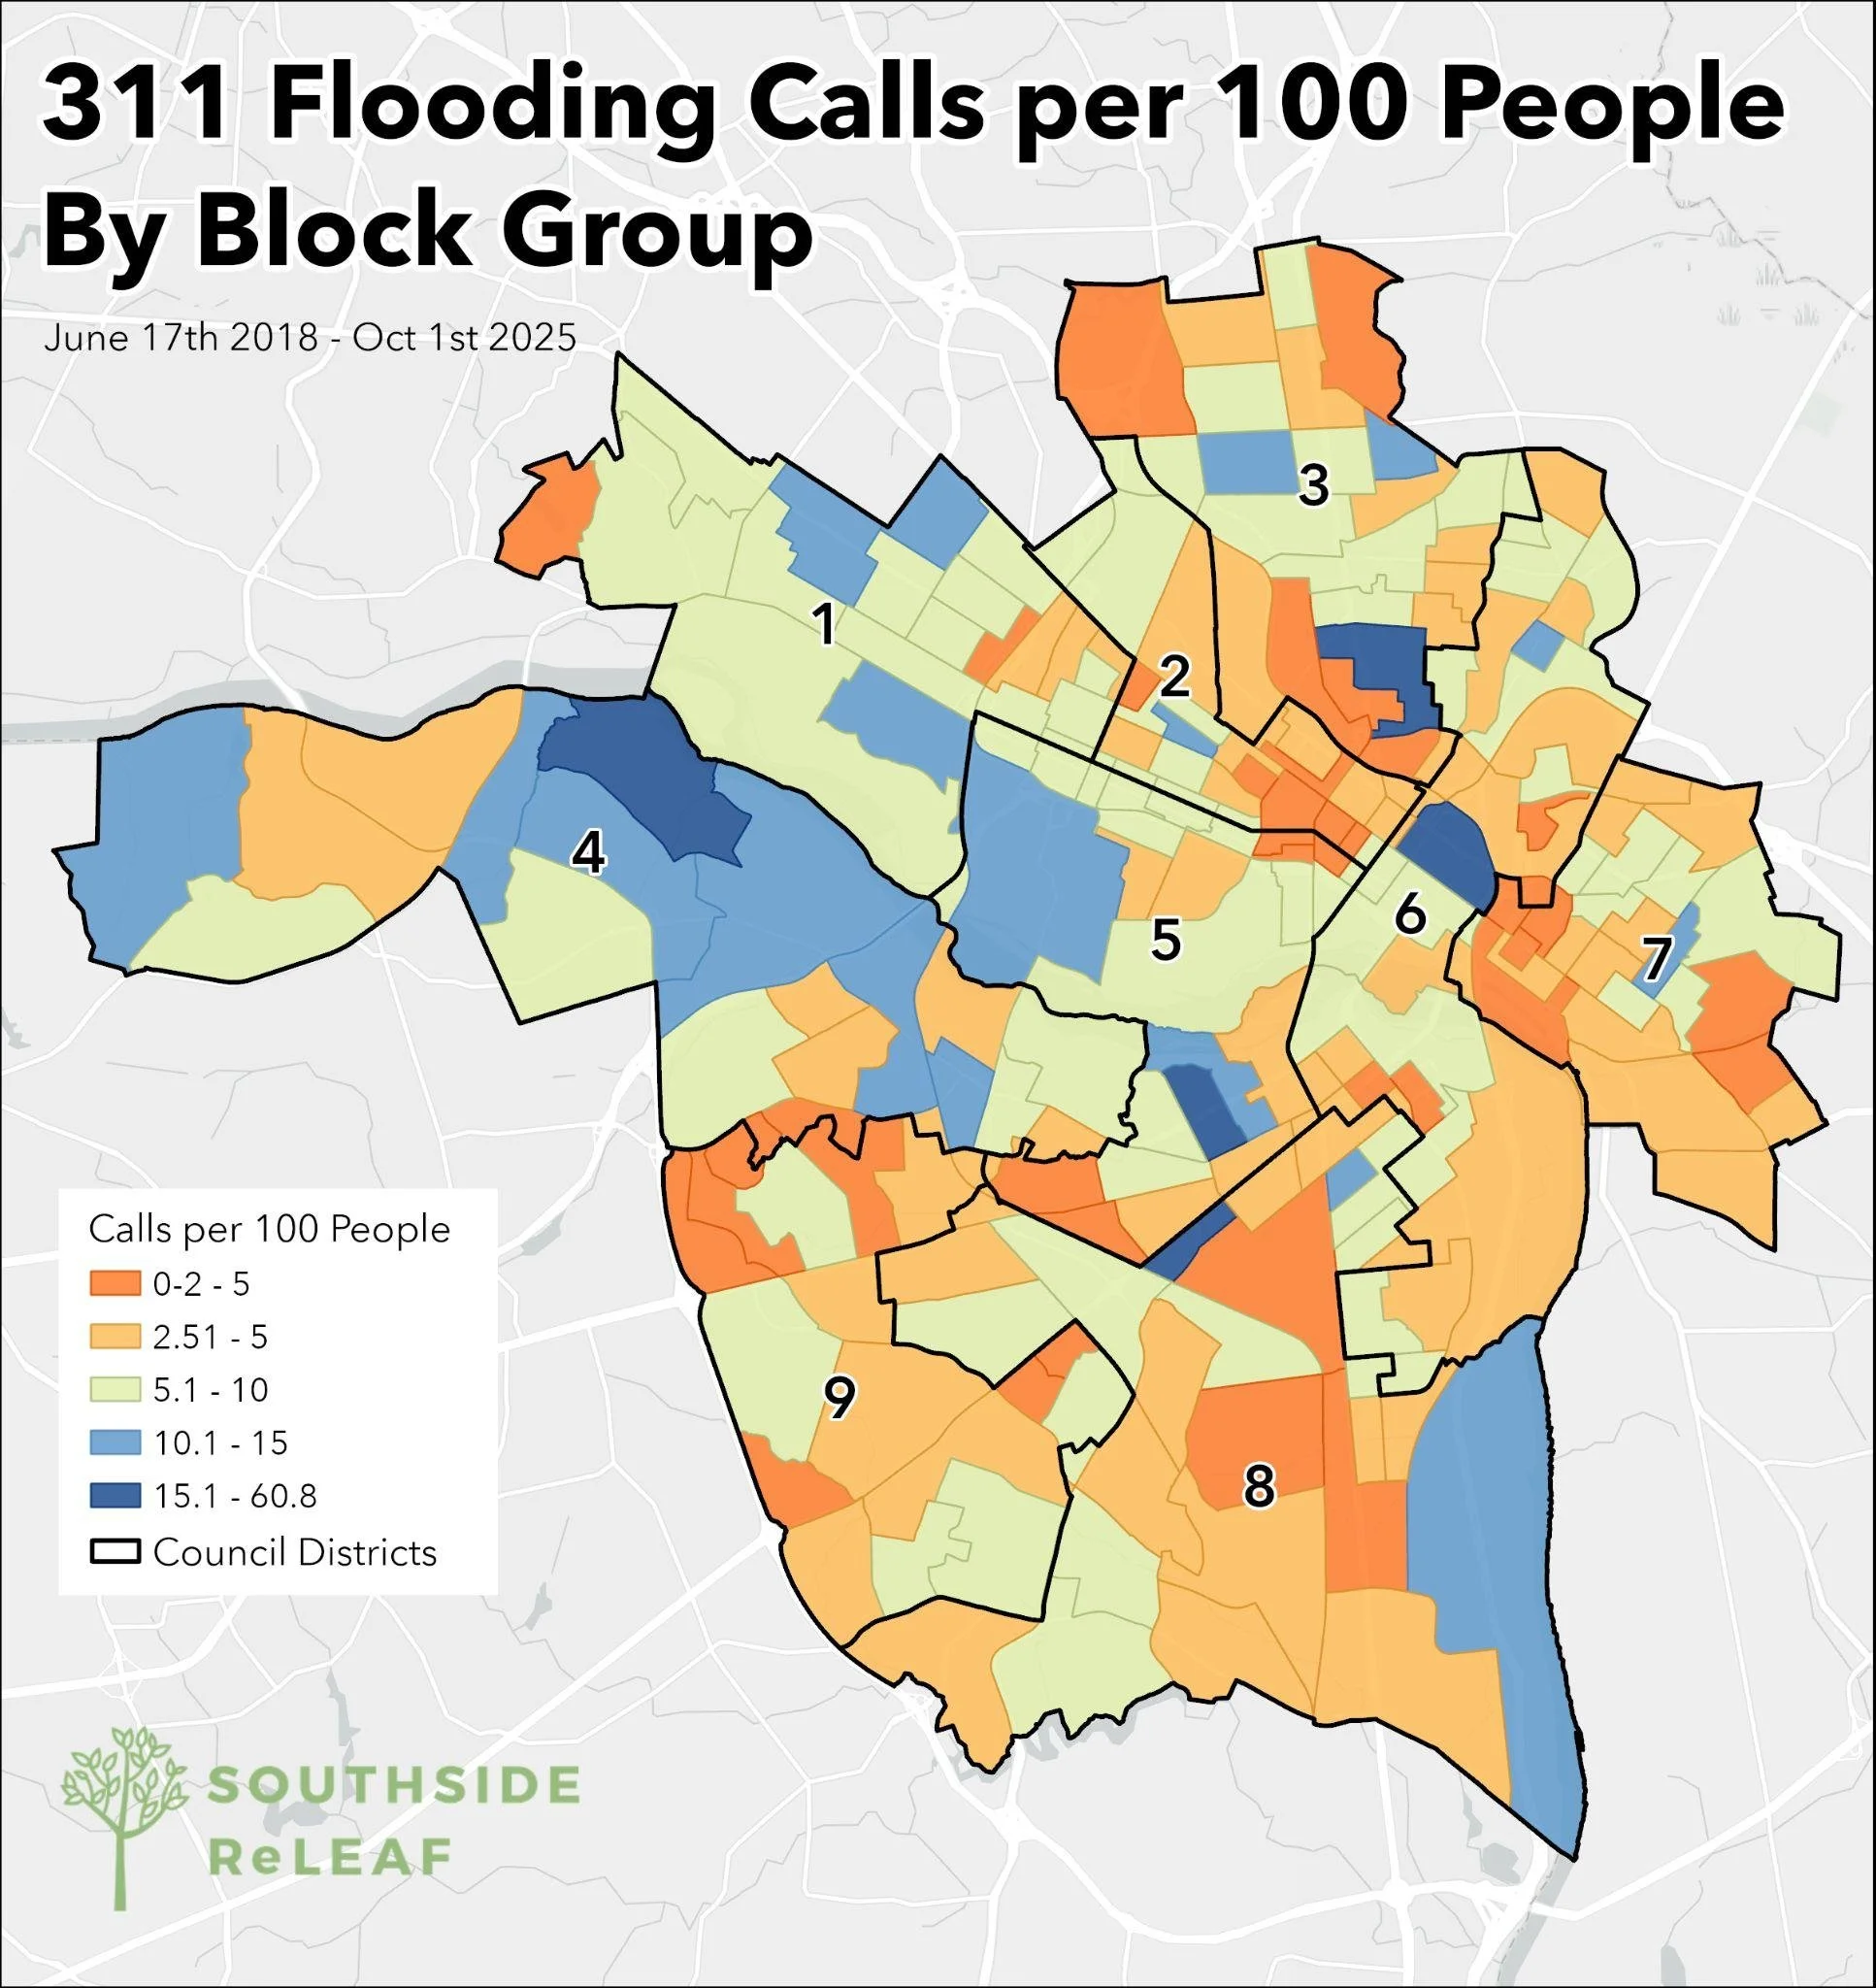
Figure 2. 311 flooding calls per 100 people by block groups (smaller geographic areas used by the U.S. Census) in Richmond, Virginia.
Between June 2016 and October 2025, Richmond residents submitted 11,478 flood-related 311 tickets (Figure 1), including requests to clean storm drains (red dots), assess standing water (blue dots), and repair stormwater drains (yellow dots).
At first glance, this may seem like a robust dataset. But when we look closer, clear differences emerge across the city.
Flood-related report rates vary widely by neighborhood — from as low as 0.2 calls per 100 residents to as high as 60.8 calls per 100 residents (Figure 2). In other words, some communities are reporting flooding far more often than others.
But lower reporting doesn’t necessarily mean less flooding.
When we look at the council district level, Southside Richmond — particularly Council District 9 — has the lowest call rate in the city. This is notable because these same areas are known to face higher flood risk due to outdated stormwater infrastructure and more flood-prone conditions.
This gap suggests that the data may reflect not just where flooding occurs, but where residents are able or willing to report it. In some neighborhoods, flooding may be underreported, meaning the full scope of the problem isn’t always visible in the city’s data.
How Long Does it Take to Get a Response?
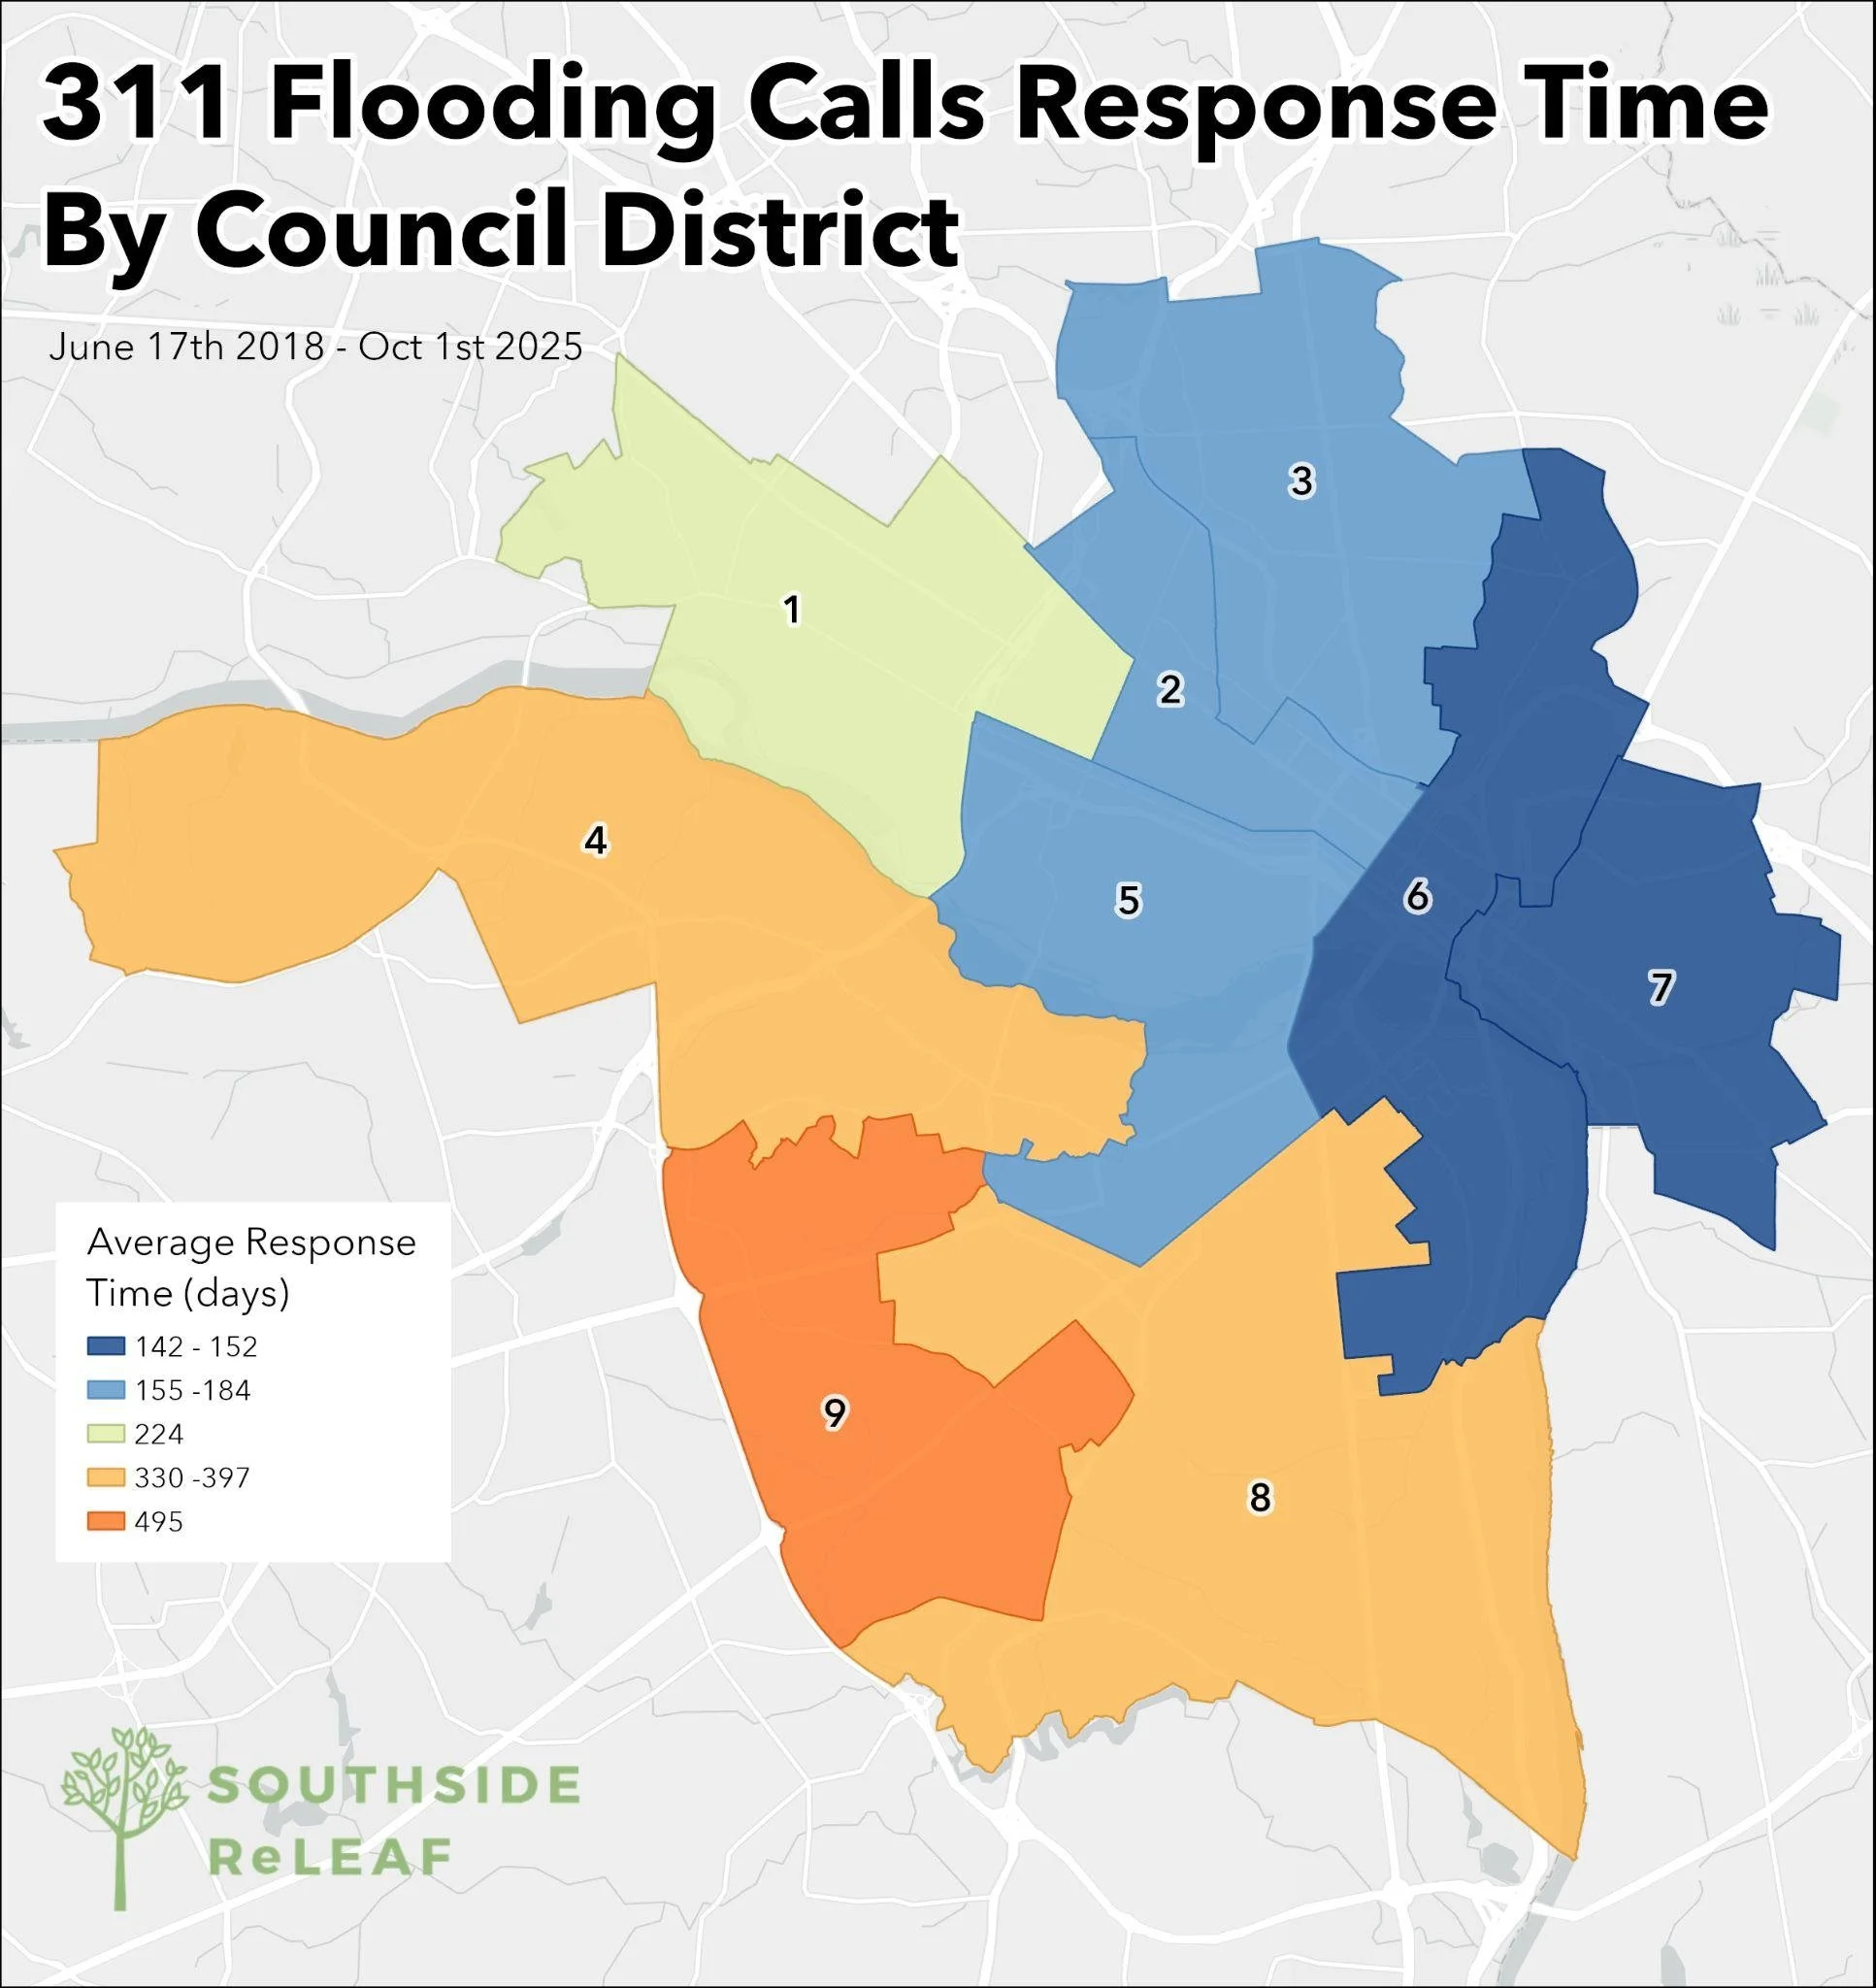
Figure 3. Average response time (length of time in days from when ticket was opened to closed) by the city to 311 flooding reports by council district in Richmond, Virginia.
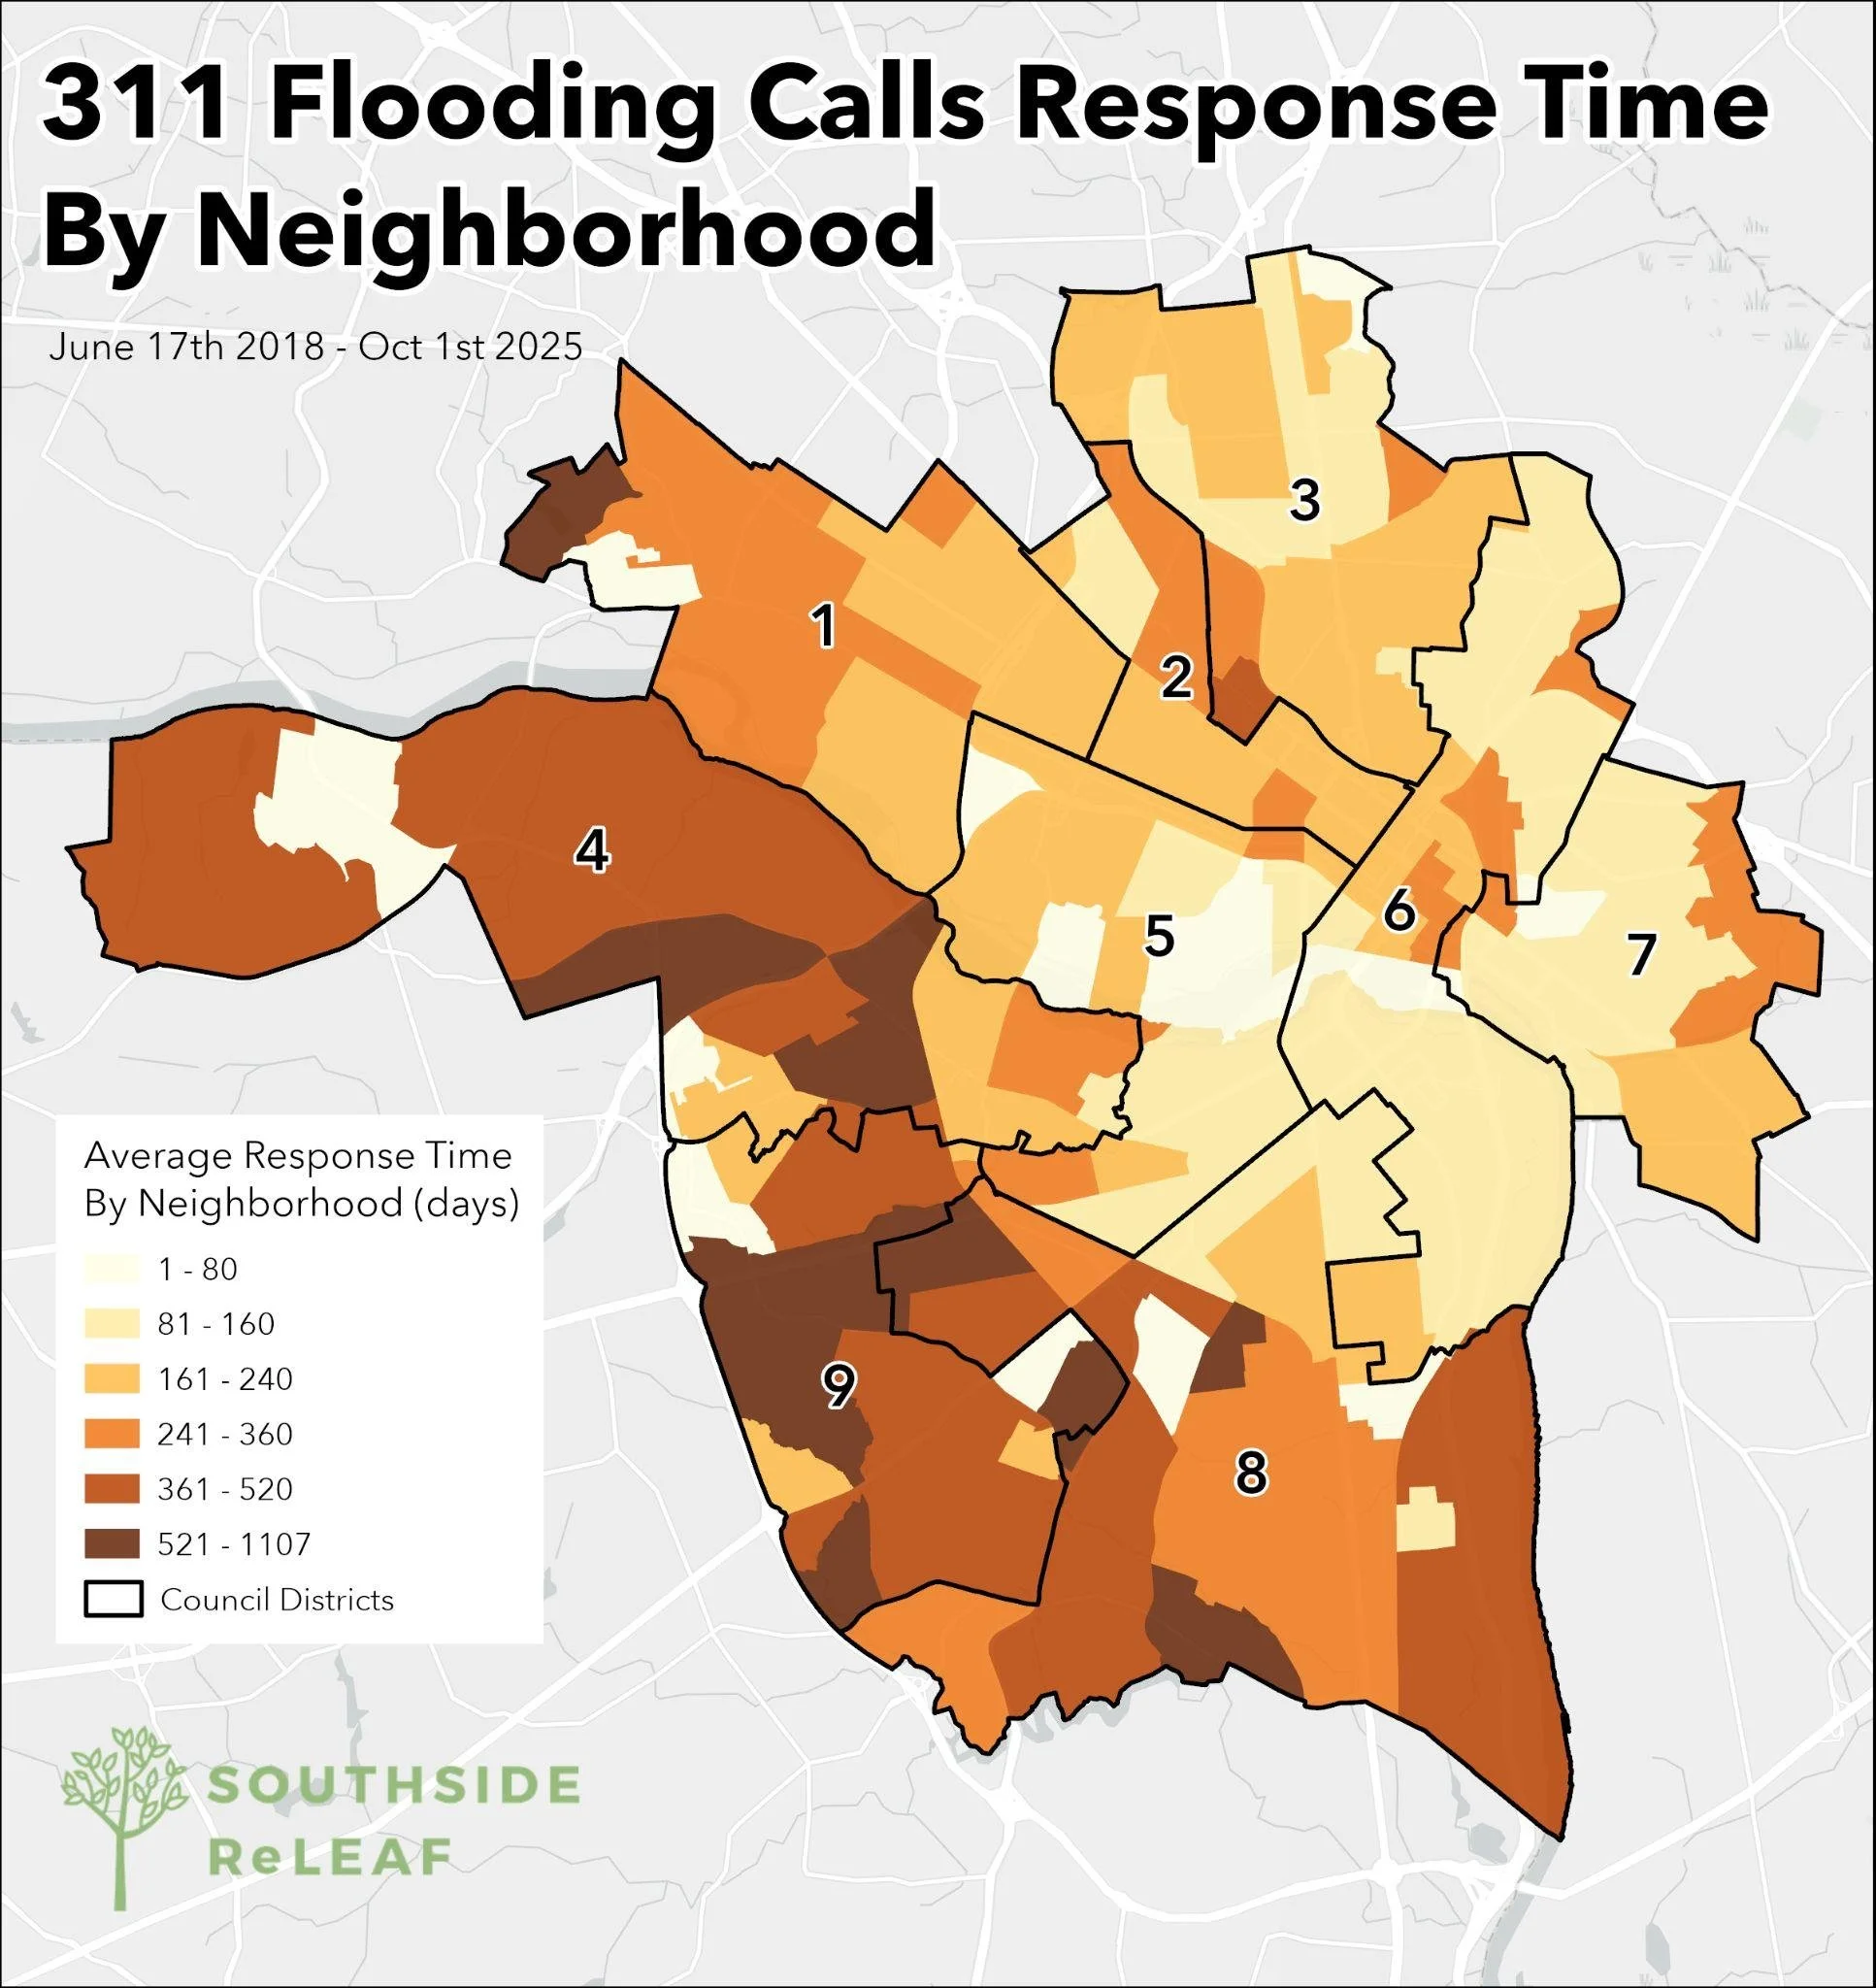
Figure 4. Average response time (length of time in days from when ticket was opened to closed) by the city to 311 flooding reports by neighborhood in Richmond, Virginia.
311 data also sheds light on how the city responds once a flooding issue is reported. Here, too, patterns vary widely.
Across Richmond, the time to close a flood-related ticket varies significantly by location (Figure 3). Council Districts 4, 8, and 9 — all in South Richmond — have the longest average response times (shown by the two orange hues in Figure 3). In fact, the average response time in District 9 is more than three times that of District 7, the district with the fastest response times: a difference of over 350 days.
When we look more closely at the neighborhood level (Figure 4), the variation becomes even more striking. Response times range from just 1 day to more than 1,100 days. Most neighborhoods with response times exceeding a year are on the Southside (shown by the two darkest hues in Figure 4).
These delays raise important questions about how resources are distributed and whether all communities are receiving timely support for flooding issues that affect daily safety and mobility. At the same time, reporting through 311 still matters. Without a record of these issues, it becomes much harder to track patterns, advocate for improvements, and hold the city accountable.
What the Data Shows about Race and Reporting
The data also reveals differences in both reporting and response times when viewed alongside neighborhood demographics.
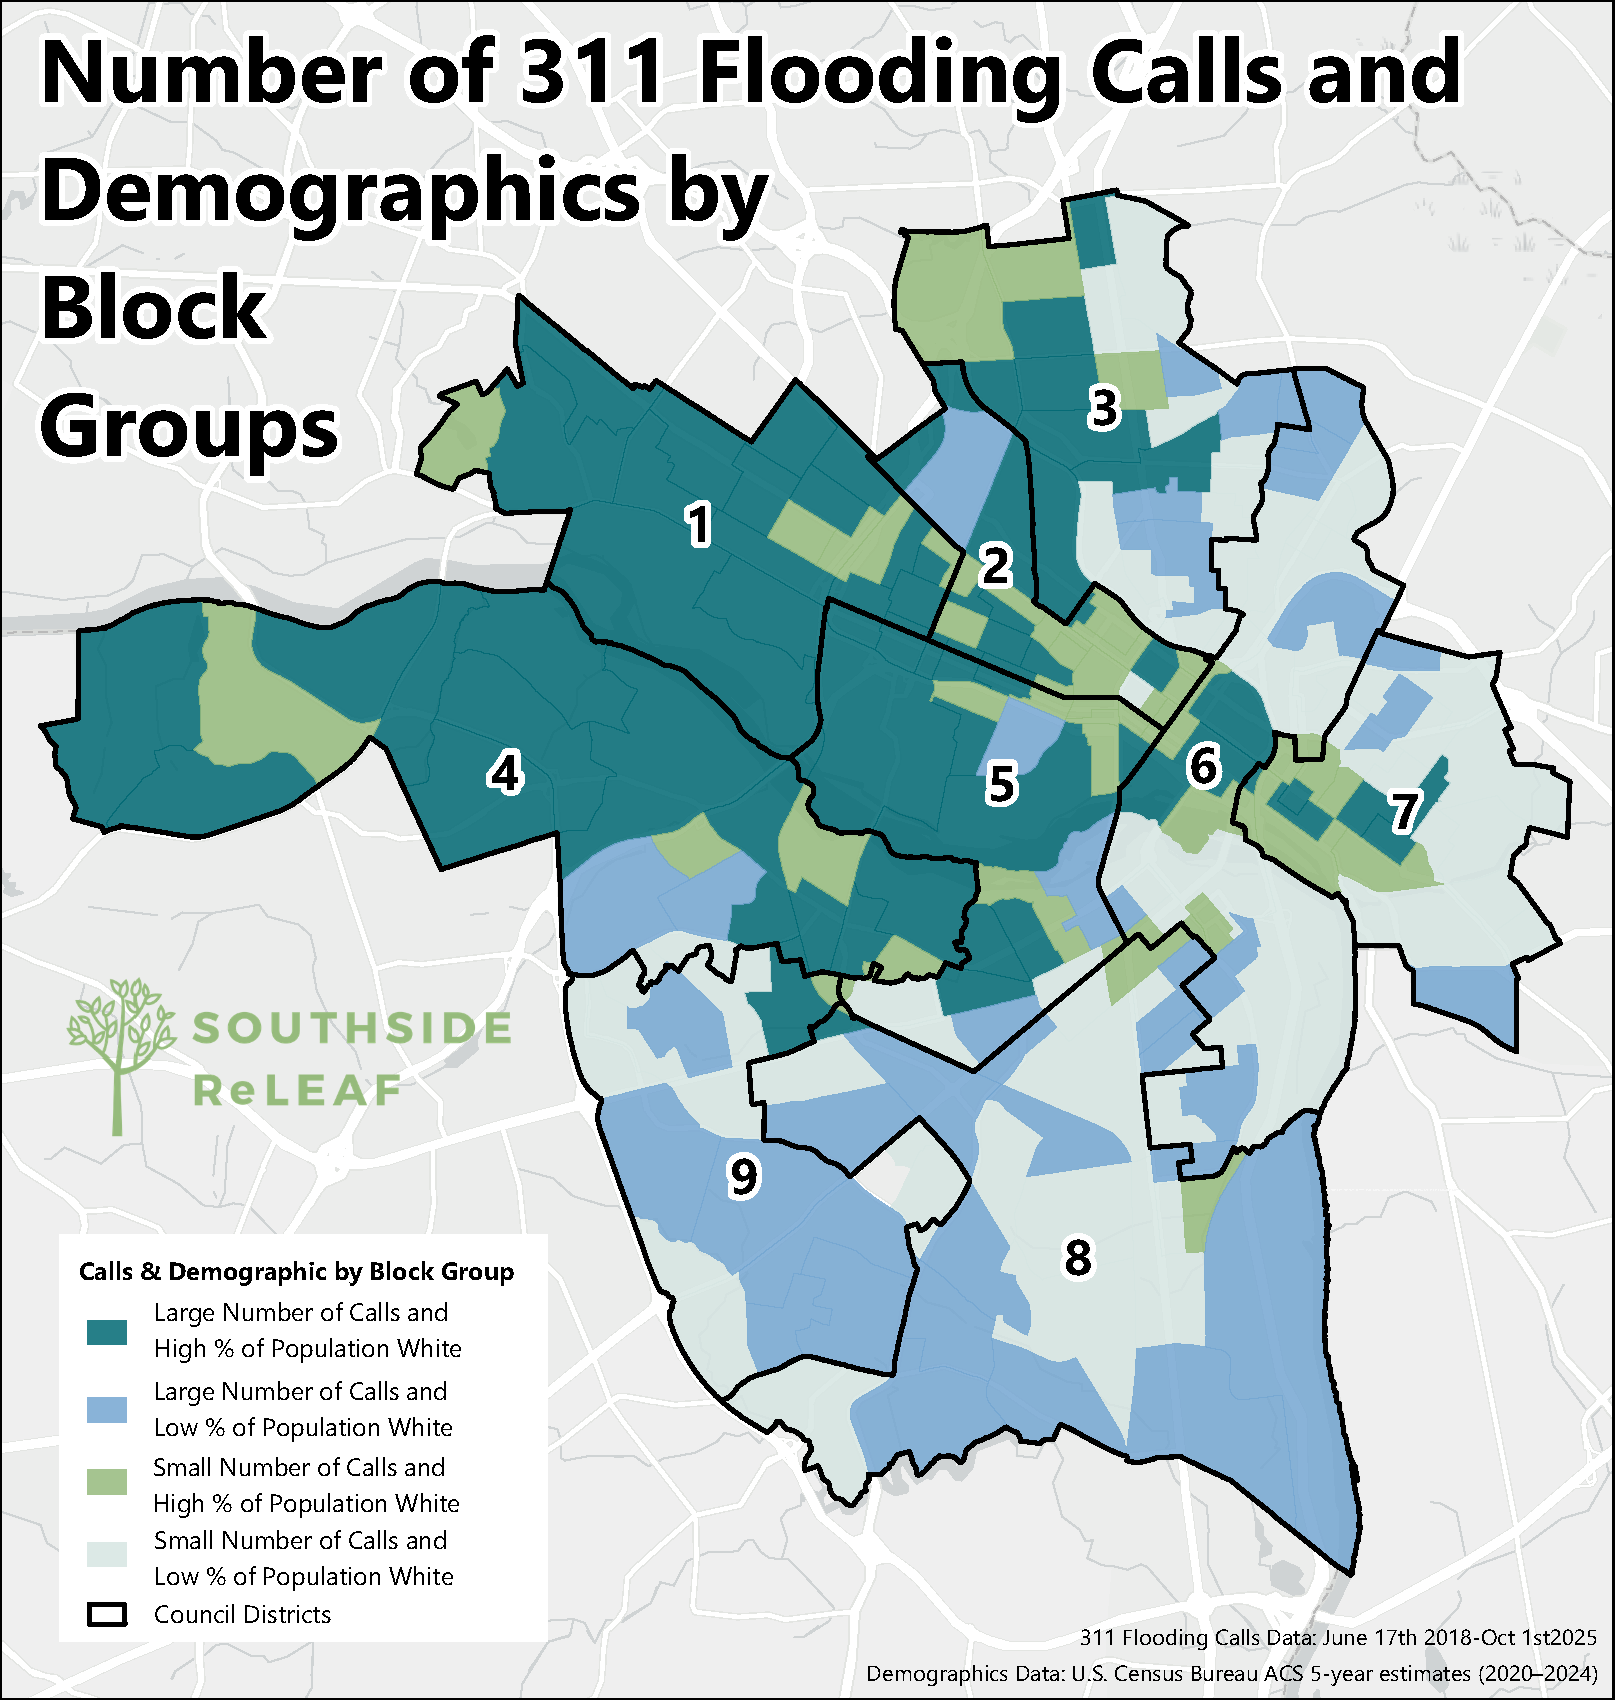
Figure 5. Number of 311 flooding reports compared to percent of population that are white by block groups (smaller geographic areas used by the U.S. Census) in Richmond, Virginia.
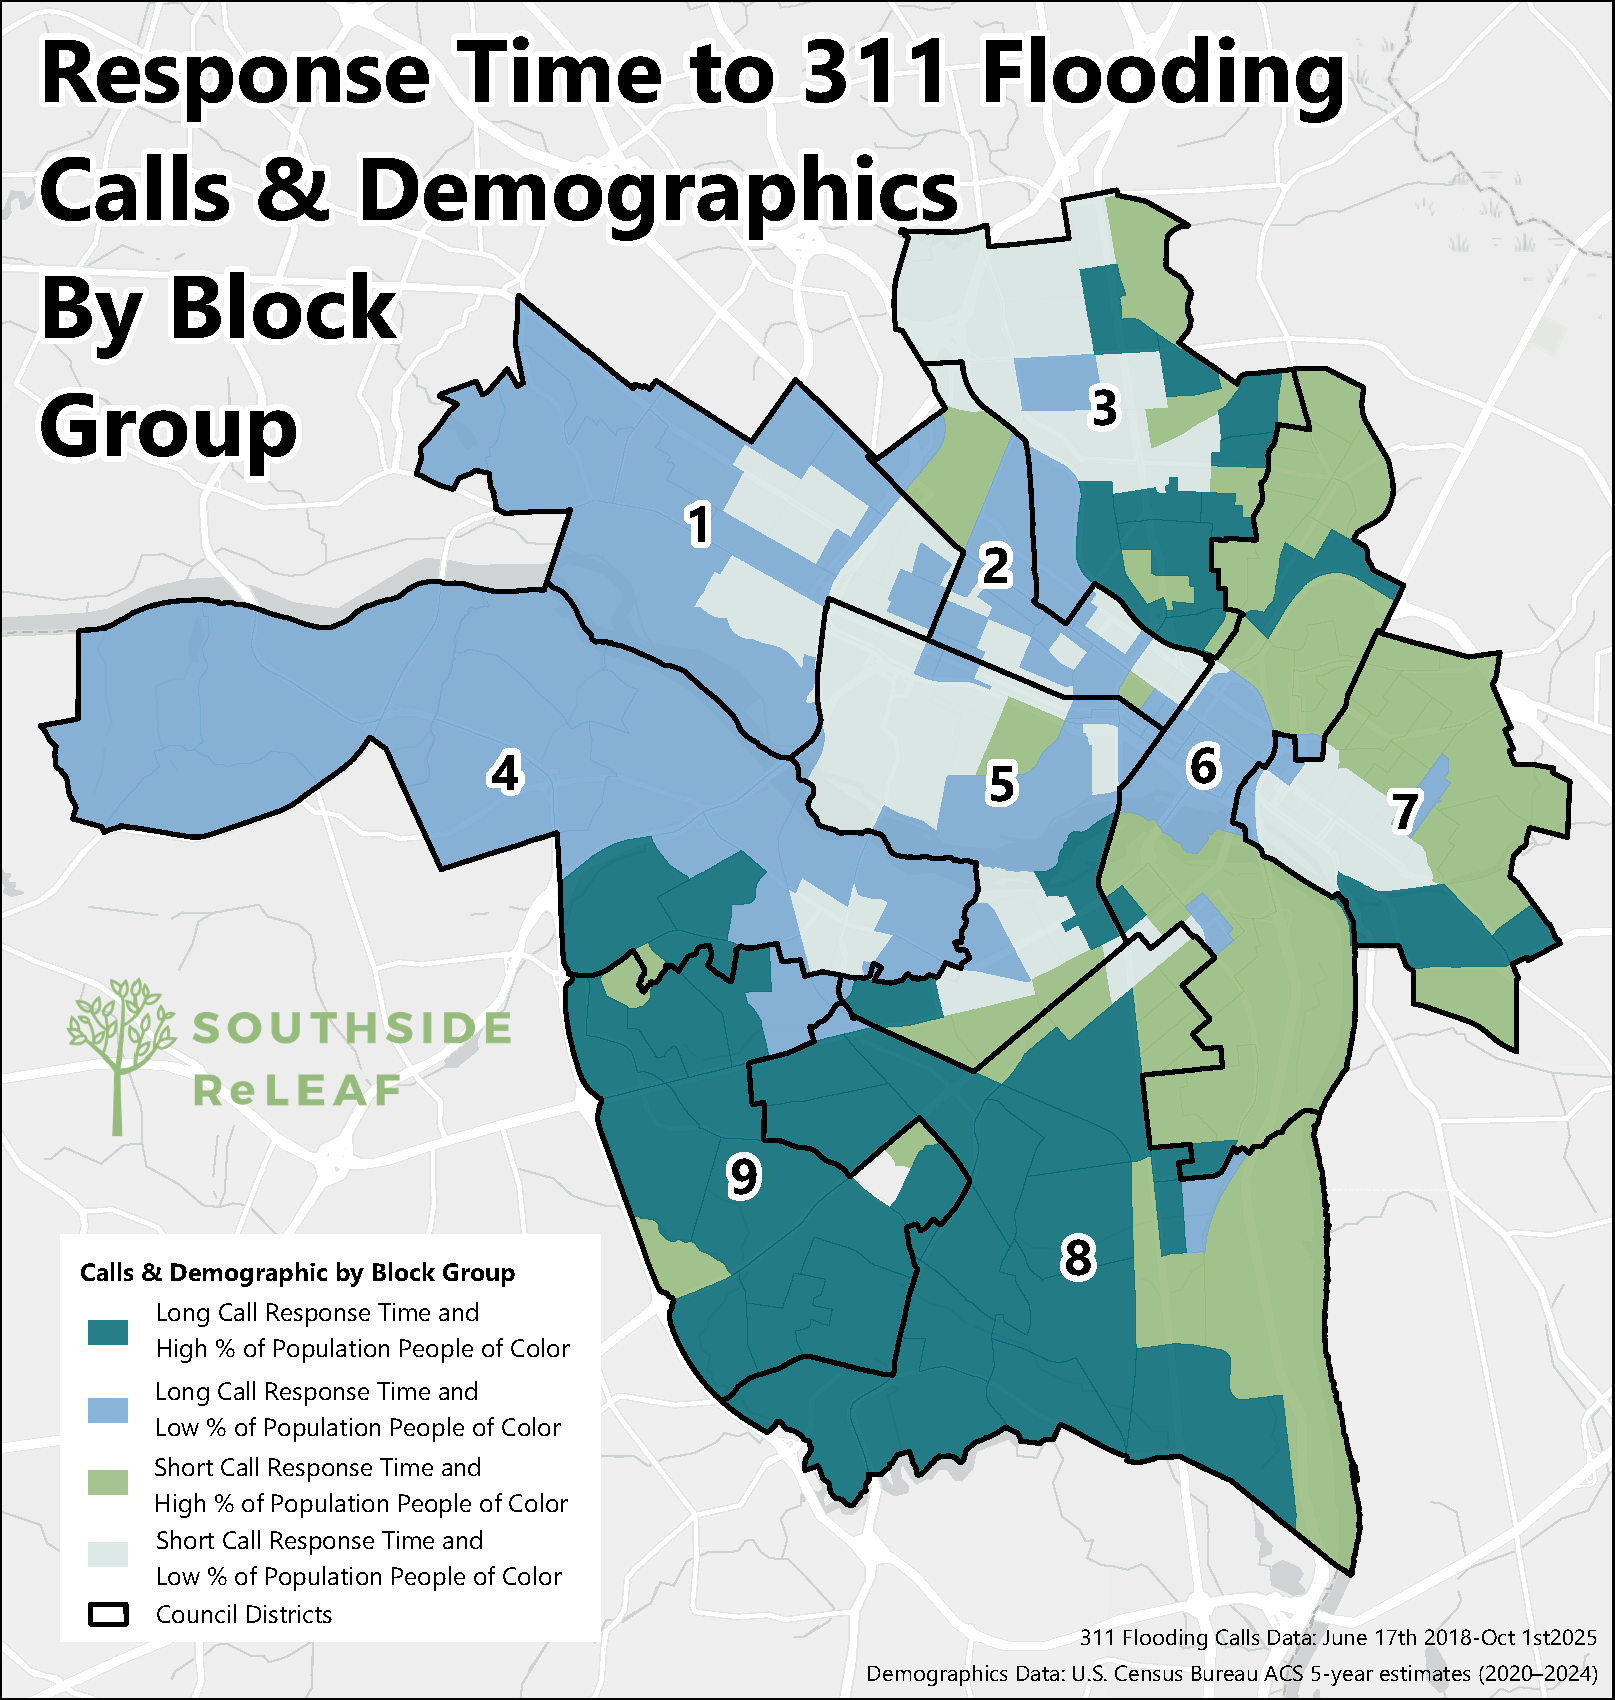
Figure 6. Average response time to 311 flooding reports compared to percent of population that are people of color by block groups in Richmond, Virginia.
Areas with higher call volumes and a higher percentage of white residents are largely concentrated in the northwestern parts of the city (shown by the teal color in Figure 5). Meanwhile, areas with lower percentages of white residents — particularly in Southside and parts of the East End — show a wider mix of call volumes, including many with low reporting rates.
When we compare response times with the share of Black and Brown residents, another pattern emerges. Neighborhoods with both longer response times and higher populations of people of color are concentrated in Southside Richmond, particularly in Council Districts 8 and 9 (shown by the teal color in Figure 6).
Taken together, these patterns raise important concerns about whether communities that are more vulnerable to flooding also face barriers to reporting — and longer wait times when they do. They also reinforce a key limitation of 311 data: it reflects reported experiences, not necessarily the full reality of flooding across the city.
Filling the Data Gaps: Go with the Flow
If 311 data only tells part of the story of urban flooding in Richmond, how do we build a more complete picture?
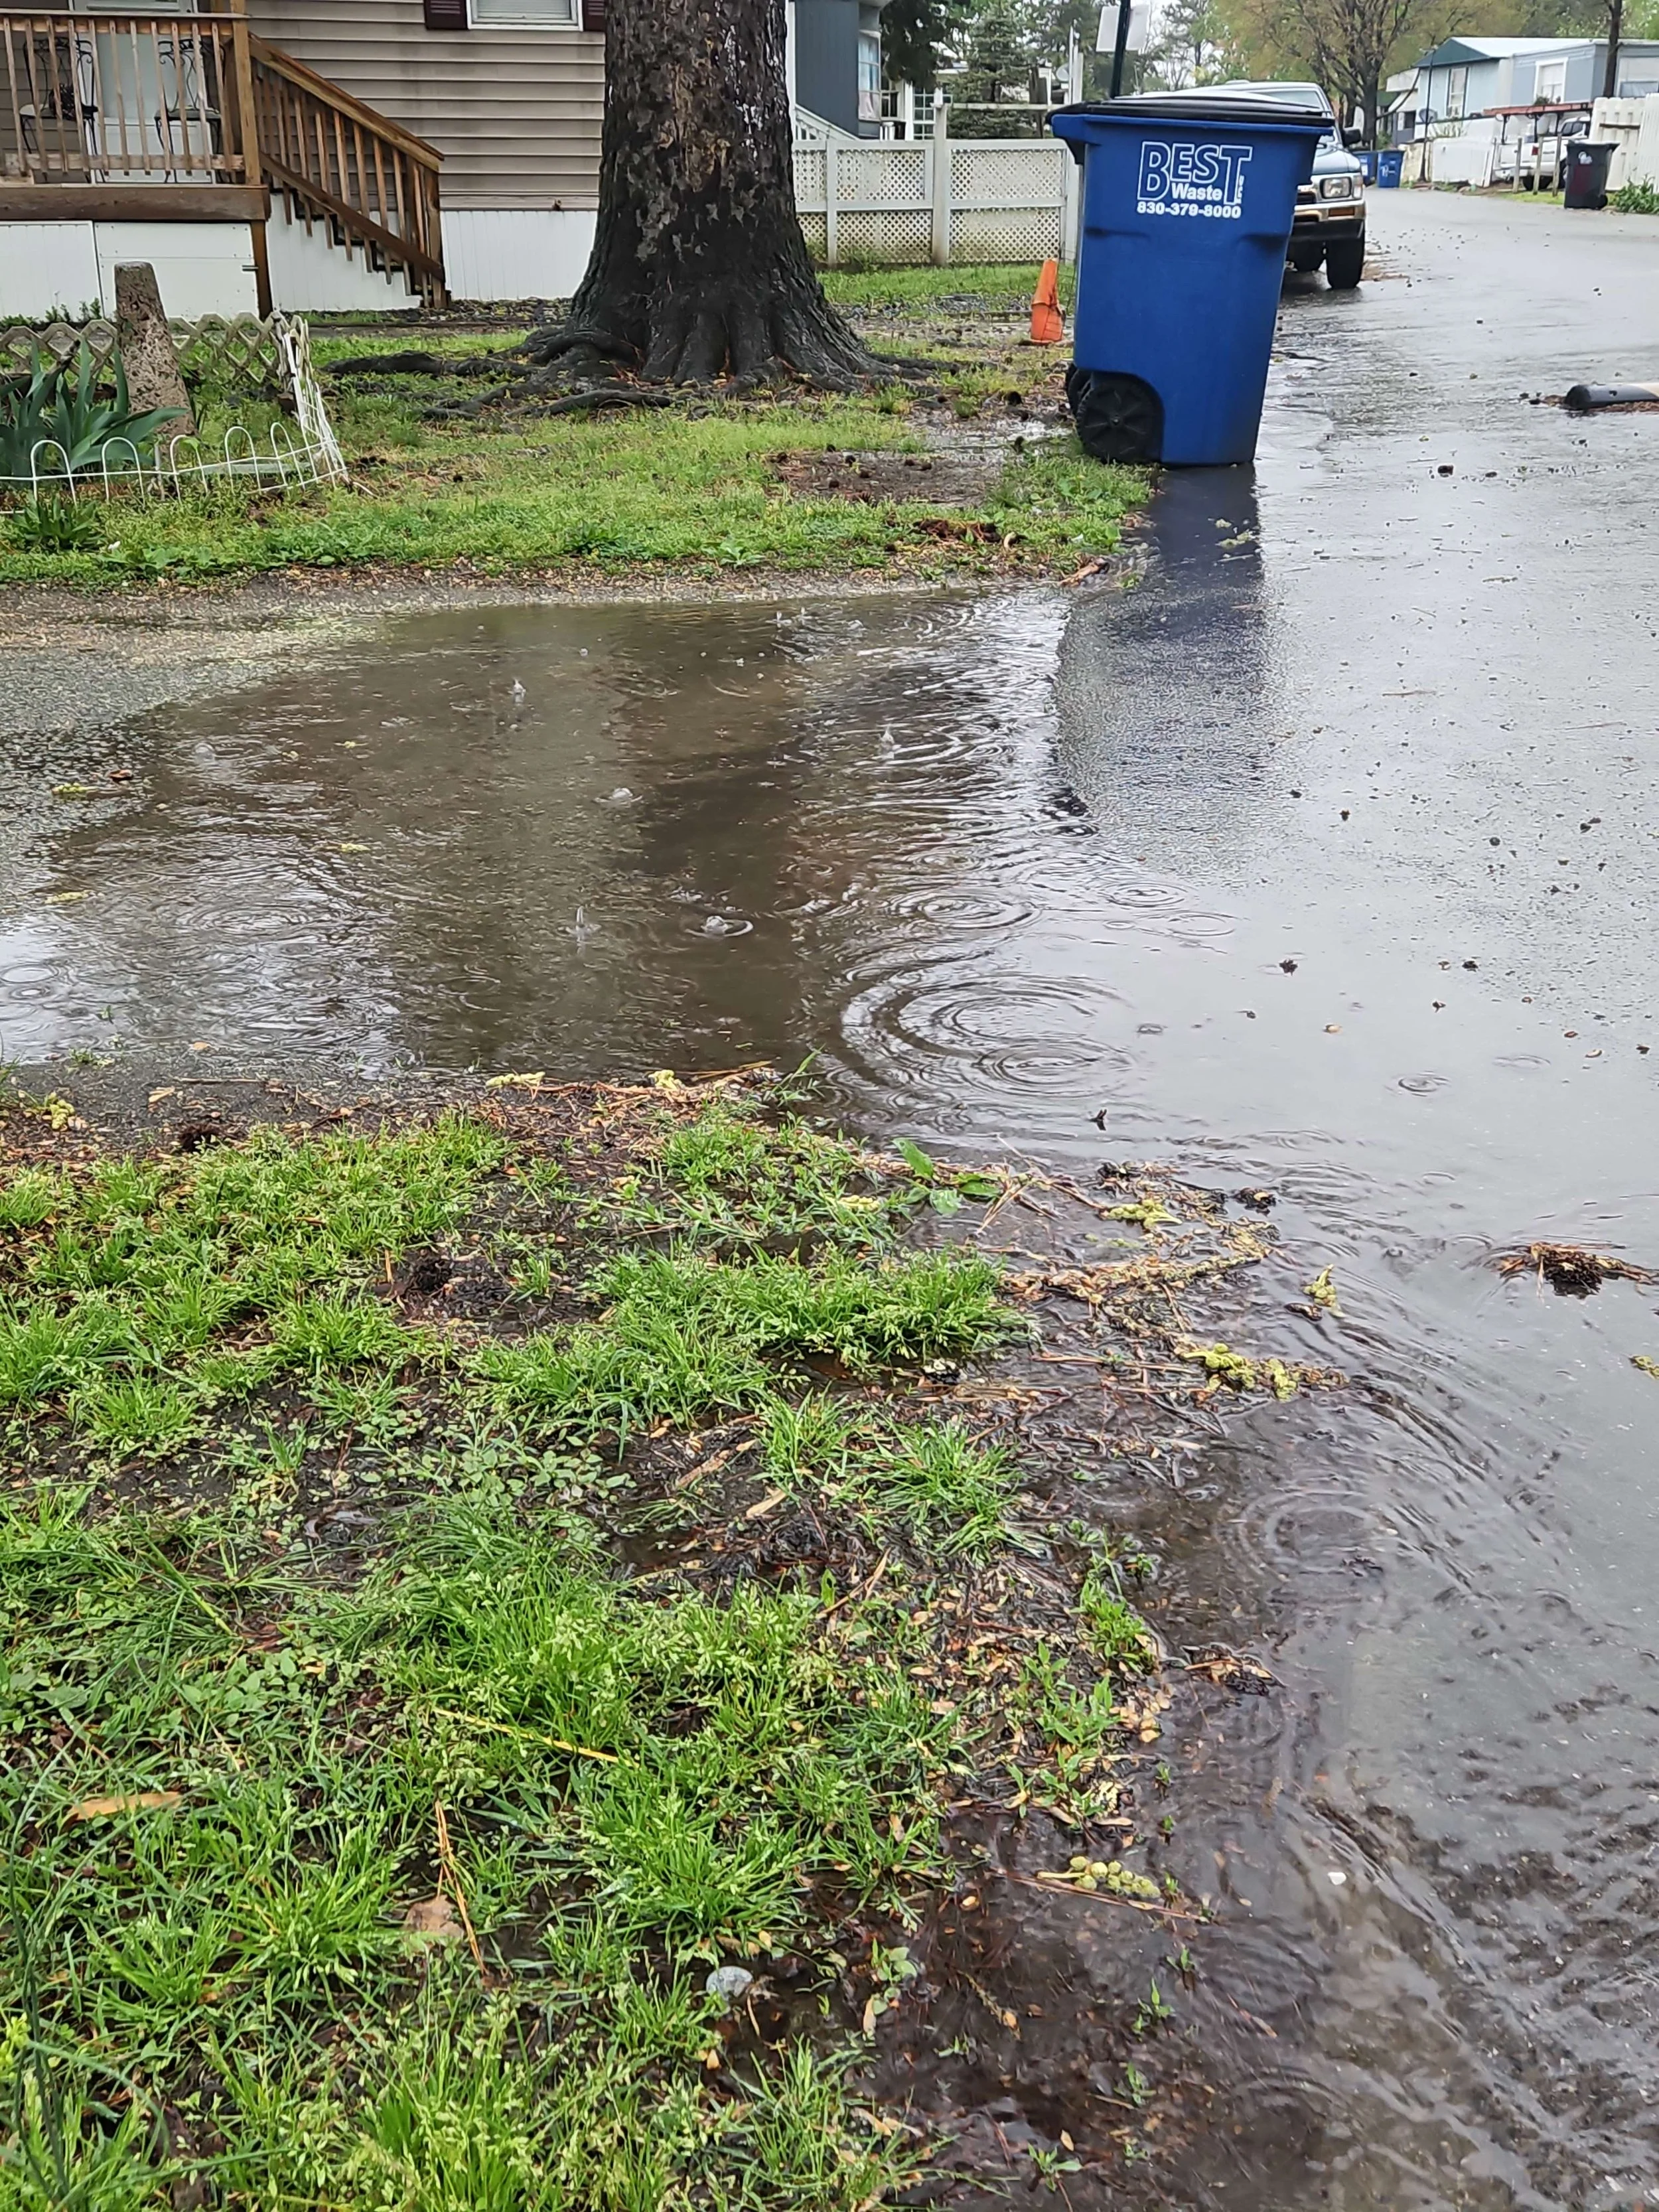
A photo of stormwater flooding in a residential neighborhood submitted by a community member through the Go with the Flow survey.
That’s where Southside ReLeaf’s Go with the Flow comes in. In collaboration with the University of Richmond, this community science project documents real, on-the-ground flooding conditions across the city.
By completing a quick online survey and sharing photos, residents help capture flooding that might otherwise go unreported through 311.
In its first year, Go with the Flow collected more than 300 surveys and hundreds of photos, helping to map how flooding impacts neighborhoods block by block. Now in its second year, the project is continuing to build that dataset and track patterns over time.
Why Reporting Matters — and How You Can Help
Understanding where flooding happens is essential to making informed decisions about infrastructure, maintenance, and capital investment. Data plays a powerful role in shaping those decisions, but without community participation, that data will always be incomplete.
By reporting flooding to 311, Richmonders help create a record that the City can act on. And by participating in Go with the Flow, you help document the full picture of how flooding affects your neighborhood.
Together, these efforts can help ensure that resources are directed where they’re needed most, and that all Richmond communities are better prepared for the challenges of increased rainfall and flooding in the years ahead.